
Meta Ads Case Study
The Barn Theatre


How RED66 Marketing Helped The Barn Theatre Turn Paid Social Into Its #1 Source Of New Web Traffic
Background
The Barn Theatre has been staging summer theatre in Augusta, Michigan since 1946. It’s the oldest resident summer-stock company in the state, now in its milestone 80th season. Eight decades of putting on show-stopping performances has built one of the most loyal audiences in regional theatre. But filling the house at the Barn isn’t like marketing a single long-running production.
The Barn runs on the summer-stock model: a rapid succession of shows across one season, each with its own opening, its own short run, and its own audience to find. A campaign that’s working beautifully for one title has only a few weeks before it has to be torn down and rebuilt for the next. To keep every production selling, the marketing has to move as quickly as the season does.
To keep up, the Barn partnered with RED66 Marketing to build a paid social engine that keeps the theatre visible all season long and feeds a steady stream of new visitors straight to its website. The results? Broad, low-cost reach across the region, and paid social becoming the single largest paid source of new people discovering the Barn online.
Of all new website visitors came from paid social
Cost per click to the Barn’s website
More new site visitors than paid search delivered
The Challenge
When you stage a brand-new show every few weeks, your advertising never gets to sit still. This fast-paced schedule is exactly what makes marketing the Barn a challenge. Every production needs its own promotional push, launched and optimized inside a tight run, then handed off to the next title before the momentum fades.
On top of the pace, the Barn draws from a regional audience in southwest Michigan rather than a major metro, so every ad dollar has to reach the right people at a sustainable cost. The work has to do two jobs at once: keep the Barn top-of-mind across the entire season, while also pushing measurable traffic to show pages and the box office.
Our Approach
RED66 built the season around Meta Ads as the primary engine for awareness and website traffic. Our strategy was designed from the start for the Barn’s quick-change rhythm, with Google Ads layered in to capture high-intent searches.
1. Built a Frequency-Driven Reach Engine
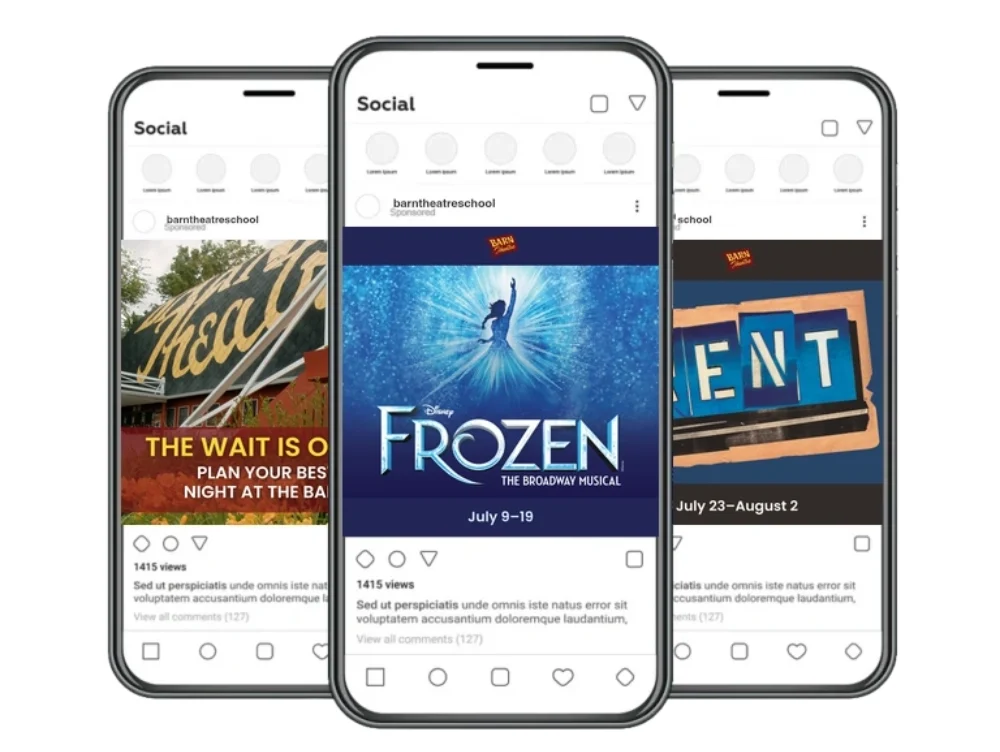
We structured Meta campaigns to the Barn consistently in front of its regional audience, aiming for repeated exposure rather than a single touch. Across the season, each person reached saw the Barn an average of nearly six times, keeping the theatre top-of-mind between shows.
2. Rotated Creative Show by Show
We refreshed campaigns in step with the season calendar so spend always sat behind the production currently on stage. As each show opened, its creative went live. As it closed, the budget swung to the next title so no impressions were wasted on a show that had already come and gone.
3. Drove Low-Cost Clicks Straight to the Site
Ads were built to send qualified, low-friction traffic directly to the website, where audiences could explore the current lineup and reach the box office. The focus on relevance kept the cost per click low and the click-through rate high all season.
4. Layered Google Ads for High-Intent Capture
Alongside paid social, we ran Google Ads to catch people already searching for the Barn by name. Targeting branded and location-based searches let us capture the highest-intent audience at the exact moment they were looking for tickets or show information.
The Results
Across the most recent full season, Meta Ads delivered broad, efficient reach and became the Barn’s leading paid source of new website visitors, all on under $10,000 in ad spend.
Meta Ads Performance (2025 Season: Jan 1 - Dec 29, 2025)
| Metric | |
|---|---|
| People Reached | 329,665 |
| Impressions | 1,944,880 |
| Average Frequency | 5.9x |
| Link Clicks to Website | 41,535 |
| Cost Per Link Click | $0.23 |
| Click-Through Rate | 2.14% |
| Total Ad Spend | $9,735.90 |
Website Traffic Driven (GA4 – New Users by Paid Source)
| Traffic Source | ||
|---|---|---|
| Paid Social (Meta Ads) | 18,731 | 19.3% |
| Paid Social (Google Ads) | 1,692 | 1.7% |
| Other | 894 | 0.9% |
| Total (All Sources) | 97,015 | 100% |
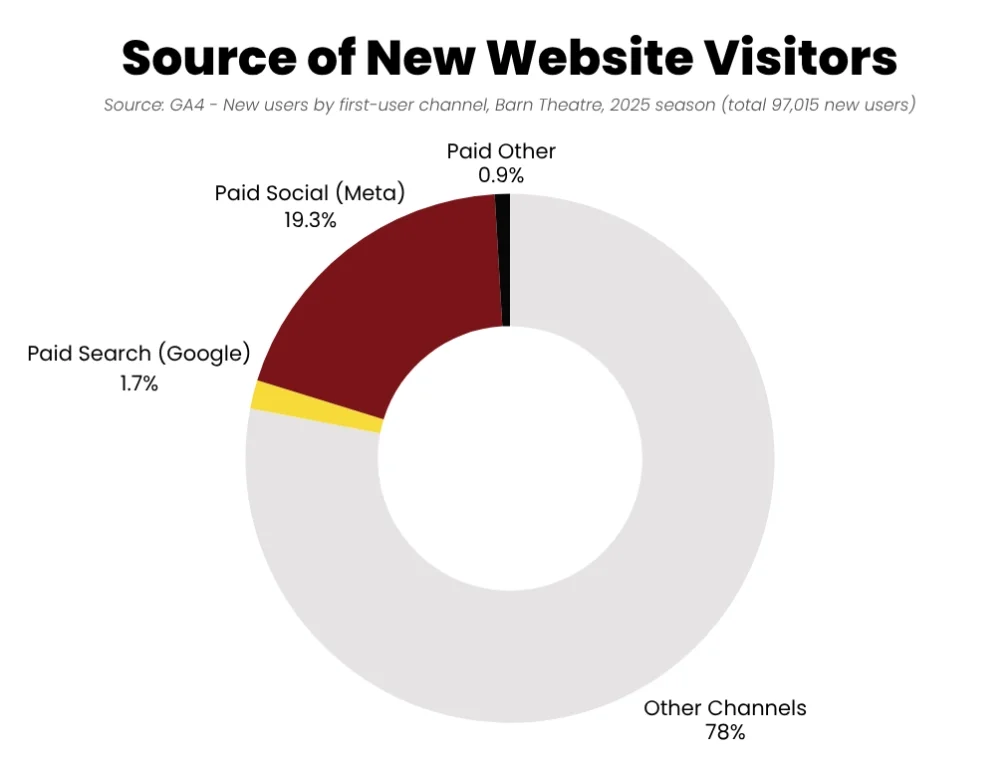
Paid social delivered 19.3% of all new website visitors in 2025, the largest paid share by far.

Head to head, paid social brought in about 11x the new visitors of paid search, at roughly $0.52 per visitor.
The account isn’t just reaching a large audience. It’s turning that reach into real website traffic at a remarkably low cost, all while being the single most productive paid channel for new-visitor growth.
Campaign Highlights
The data speaks for itself. The story underneath tells you how paid social worked: Broad reach up top, cheap and constant clicks in the middle, and paid social outpacing every other paid channel for new traffic.
It started with reach. Meta Ads put the Barn in front of 329,665 people and generated 1,944,880 impressions, at an average frequency of 5.9. This shows strong, repeated visibility that carried the theatre through every show change of the season.
The clicks were cheap and constant. The campaigns drove 41,535 link clicks to the website at an average cost per click of just $0.23, with a 2.14% click-through rate. This is clear proof that the creative and targeting were resonating and moving people to act.
Paid social became the #1 paid traffic source. According to GA4, 19.3% of all new visitors to the Barn’s website came from a Meta ad (nearly 1 in 5). That’s roughly 11x more new website users than paid search delivered, at a blended cost of about $0.52 per new visitor. For driving fresh audiences to the site, no other paid channel came close.
Google Ads closed the high-intent searches. While Meta generated demand and traffic, Google Ads caught those who were already looking for the Barn. Year over year, branded, show-specific, and location-based search drove conversions from 69 to 182 (+164%), with impressions up +120%.
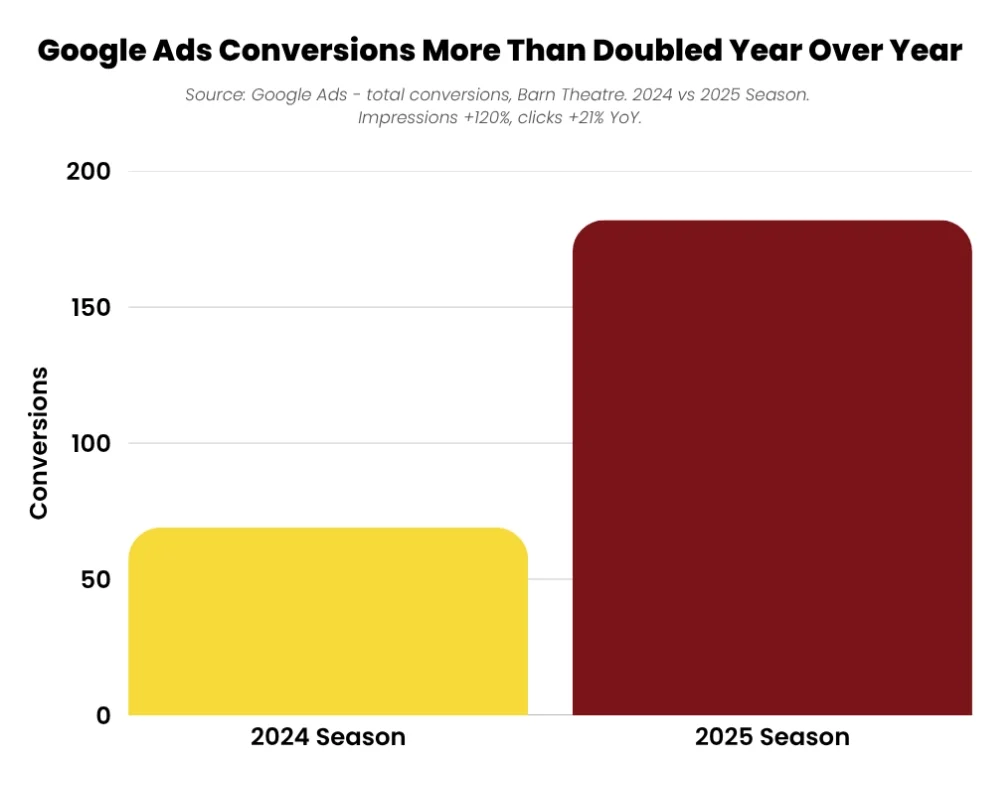
Google Ads conversions more than doubled year over year (+164%), capturing high-intent searchers as Meta drove new demand.
The 80th Season Is Already Delivering, and We Can See Ticket Sales
This story doesn’t end with the 2025 season. The Barn’s milestone 80th season is underway right now, and the same engine is already at work with a major upgrade: For the first time, ticket purchases are showing up in the data.
Through the first half of the 2026 season (Jan 1 - Jun 24), Meta Ads have driven 9.669 link clicks to the website on 339,679 impressions, holding the same standout $0.23 cost per click even as the season’s biggest shows are just getting started. The flagship show campaign is performing even better, pulling clicks at just $0.13 each.
- 283 > Ticket purchases now tracked in GA4 this season (all sources)
And that’s the breakthrough. Ticket-purchase tracking is now live in analytics: GA4 has recorded 283 purchases, plus 15 gift-certificate and 19 shop purchases, so far this season. Paid social remains one of the site’s top traffic sources, driving about 3x the sessions of paid search, and Meta’s pixel has begun recording purchases directly.
*2026 figures cover Jan 1 - Jun 24, 2026 (season-to-date) and will grow as the summer season peaks. GA4 purchase counts reflect all traffic sources; channel-level (paid-social) purchase attribution is in progress.
Meta Ads Brought In Nearly 1 in 5 New Visitors
For a theatre, a new website visitor is the top of the ticket funnel. This could be someone discovering a show, checking dates, finding the box office. So the right way to read this account isn’t impressions, it’s how many new people paid ads put in front of the Barn’s lineup.
Nearly 1 in 5 of every new person who found the Barn’s website came from a Meta ad, 18,731 new visitors in a single season at roughly $0.52 each. That’s the difference between hoping the right audience stumbles onto your site and reliably delivering them to your show pages, week after week, as the lineup changes. It’s also a far more efficient front door than paid search: Meta brought in 11x the new visitors of Google Ads for a fraction of the cost per person.
That traffic is now starting to connect directly to ticket sales. As of the 80th season, GA4 is recording purchases — proof the funnel works end to end. The final step is attributing those purchases by channel, so the Barn can see exactly how many seats paid social fills, not just how many visitors it sends.
*Performance figures reflect the most recent completed season (Jan 1 - Dec 29, 2025) unless noted as 2026 season-to-date. Website traffic and purchase data sourced from GA4. Cost-per-visitor figures are blended estimates (total Meta spend ÷ Meta-attributed new users). Channel-level ticket-sales attribution in progress.
The Real Measure: Seats Filled
Theatre tickets aren't impulse buys driven by a single click. A patron might catch a show announcement on Facebook, come back a week later through a Google search, check dates on the season page, and finally buy at the box office. That multi-touch path is exactly why we don't draw a one-to-one line from any single ad to any single ticket, but it's also why the full funnel matters. This season, every stage of it is working.
At the top, Meta Ads generate the reach and the low-cost traffic. In the middle, that traffic lands on the pages that matter (the 2026 Season Schedule and Box Office were among the most-viewed pages on the site this season). At the bottom, the box office is posting real, strong numbers for the very shows the campaigns are promoting.
See how this worked for
Guarantee Roofing & Fence.
What’s Next
With a proven paid social engine in place and the 80th season already underway, RED66 is running the same playbook at full tilt: keep the theatre visible all year, swing creative and budget behind each show as it opens, and connect every click to the box office.
You don’t always need a bigger budget to reach a bigger audience, you just need a strategy nimble enough to keep up with your season and efficient enough to make every dollar count. We helped The Barn Theatre turn paid social into its busiest front door, and we can show you what’s possible for your organization.